Learn how to connect LangGraph multi-agent workflows to a live FastAPI dashboard. Transform terminal AI scripts into a production web app UI.
In Part 1, our LangGraph multi-agent system successfully turned messy customer reviews into structured intelligence. It knows exactly which customers are angry, which bugs are critical, and who might cancel their subscription.
But we have a massive production bottleneck:
Your CEO is not going to open an
outputs/analyzed_reviews.jsonlfile.Your support manager is not going to run
python run_batch.py.Nobody wants to scroll through terminal logs to find
CUST-047 | CRITICAL.
Your AI is doing brilliant work, but that intelligence is completely trapped in the backend.
The Solution: Building a FastAPI LangGraph Dashboard
In Part 2, we are bridging the gap between the AI backend and the end-user. We will deploy our multi-agent workflow using a FastAPI web server to build a live, interactive customer intelligence dashboard.
By the end of this tutorial, you will master FastAPI LangGraph integration. We will completely demystify the magic and show you step-by-step how a raw JSON output from a LangGraph agent becomes a beautiful UI widget on a web page.
(📦 Source Code Included: You do not need to piece together random code snippets. The complete project—including the FastAPI server, LangGraph backend, HTML, CSS, and JavaScript—is provided for you to download and run).
What Changed from Part 1?
The core LangGraph multi-agent system hasn’t changed. We didn’t rebuild our four AI agents, and we didn’t touch the graph logic. We simply wrapped a FastAPI application layer around the backend we already created.
The Architecture Shift:
Part 1: LangGraph Agents ➔ Terminal Output (JSONL)
Part 2: LangGraph Agents ➔ FastAPI Backend ➔ Live Web Dashboard
The New Project Files
Our existing src/ backend remains.
Part 2 adds the web application pieces:
Each new piece has one clear responsibility:
That separation matters. FastAPI should not contain 400 lines of chart rendering code, and JavaScript should not know how our LangGraph state works. Each layer gets its own job.
Install the Web Dependencies
Part 1 already gave us LangGraph, Groq and Pydantic.
Now requirements.txt additionally contains:
Install everything:
What are these three packages?
FastAPI builds our web API.
Uvicorn is the server that actually runs the FastAPI application.
Jinja2 lets FastAPI serve our HTML template.
A simple mental model is:
Transforming Raw AI JSON Data into Dashboard KPIs
Before we build our FastAPI endpoints, we need to prepare our data.
In Part 1, our LangGraph agents processed 100 reviews and saved them to outputs/analyzed_reviews.jsonl. Every line in this file is a perfect, machine-readable JSON object representing one customer’s FinalAnalysis:
{
  "customer_id": "CUST-047",
  "feedback": "PDF uploads crash...",
  "sentiment": { "sentiment": "negative", "frustration_score": 9 },
  "routing": { "department": "Engineering" },
  "priority_score": 92.5,
  "priority_level": "CRITICAL"
}
The Data Problem: This raw JSON is great for backend storage, but frontend charts cannot read individual records.
A visual dashboard needs aggregated KPI data. A chart doesn’t want to read 100 individual JSON lines; it just wants the final math:
Sentiment Chart Needs: Negative = 59, Neutral = 23, Positive = 18
KPI Card Needs: Total Critical Customers = 22
Department Chart Needs: Engineering = 34, Product = 27
The Solution: We need a data transformation layer to bridge the gap between our raw AI output and our web UI. This is exactly what our new dashboard_service.py file does—it reads the JSONL data, aggregates the metrics, and serves ready-to-use numbers to our FastAPI charts!
Loading AI Data safely with Pydantic Validation
Before we build charts, we need to load the 100 AI responses we saved in Part 1 (analyzed_reviews.jsonl).
But we don’t just load them as messy, random dictionaries. We use Pydantic to strictly validate every single line of text back into a perfect Python object (FinalAnalysis).
results = []
with path.open("r", encoding="utf-8") as f:
    for line in f:
        if line.strip():
            # Validate raw JSON straight into a strict Python object
            results.append(FinalAnalysis.model_validate_json(line))
The Data Pipeline: Raw JSONL Text ➔ Pydantic Validation ➔ List of 100 FinalAnalysis Objects
This guarantees that by the time our FastAPI dashboard touches the data, it is 100% bug-free and structured.
Transforming AI Results into Dashboard KPIs
Frontend UI libraries (like Chart.js) cannot read 100 individual customer reviews. They need aggregated metrics—like total counts and averages.
Inside our dashboard_service.py, we use Python’s built-in Counter to instantly group our data.
# Instantly count how many reviews are Negative, Positive, etc.
sentiment = Counter(x.sentiment.sentiment for x in results)
priority = Counter(x.priority_level for x in results)

# Group them into a simple KPI dictionary for the frontend
"summary": {
    "total_reviews": len(results),
    "critical_count": priority["CRITICAL"],
    "negative_count": sentiment["negative"],
}
How it works in plain English: Instead of sending 100 separate records to the browser, Counter looks at three negative reviews and simply outputs: {"negative": 3}.
The Final Dashboard Payload Flow: 100 Pydantic Objects ➔ Python Counter() ➔ Clean Dashboard KPIs (Summary, Sentiment, Priority)
This perfectly structured JSON payload is exactly what our FastAPI endpoint will send to the frontend!
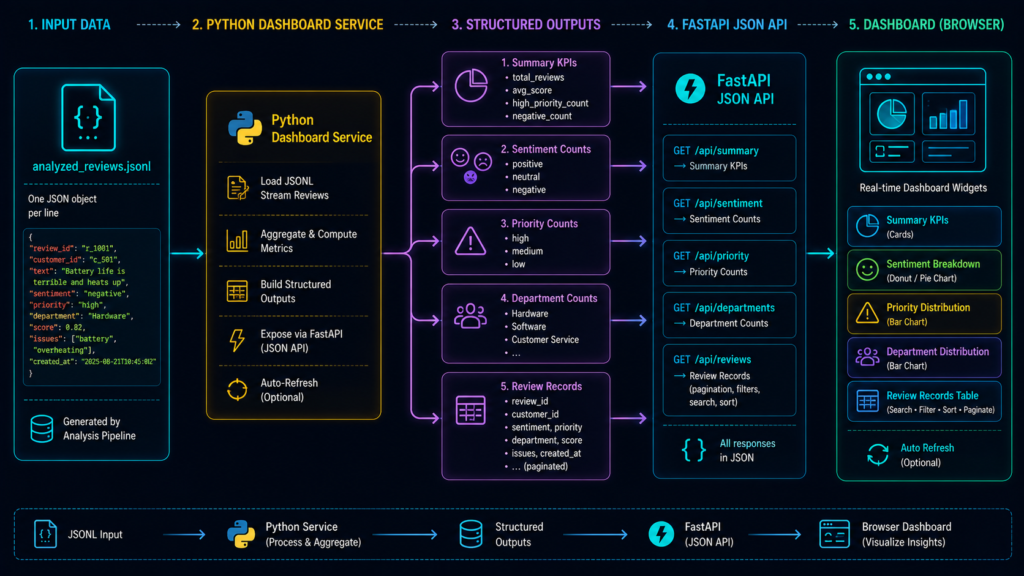
FastAPI: The Bridge Between Python and the Browser
Now open app.py. The most important imports are:
And from our own project:
That last line is the key connection:
FastAPI is importing the same compiled LangGraph application used by our command-line project.
Architecture:
We are not calling LangGraph through another server. FastAPI and LangGraph live inside the same Python application. That makes the integration quite simple.
Setting Up the FastAPI App
First, we need to initialize the core FastAPI engine. We define our app with all its details so it acts as a proper, documented backend.
# 1. Initialize the FastAPI App
app = FastAPI(
    title="Customer Feedback Intelligence",
    version="1.0.0",
    description=(
        "Parallel multi-agent customer feedback "
        "analytics dashboard."
    ),
)
What this does:
title,version,description: These aren’t just random words! FastAPI automatically uses these to generate beautiful, built-in API documentation (Swagger UI) for your AI project.
Next, we must tell FastAPI where our web design and logic files live. By default, FastAPI is a backend API and doesn’t know what CSS or JavaScript is.
# 2. Tell FastAPI where static frontend files live
app.mount(
    "/static",
    StaticFiles(directory=BASE_DIR / "static"),
    name="static",
)
What this does:
app.mount: Think of this as opening a secure folder to the public internet. We are telling FastAPI, “Whenever a web browser asks for/static, look inside mystaticfolder.”That securely exposes exactly these two files to the browser:
static/styles.css(Makes the dashboard look beautiful)static/app.js(Makes the dashboard charts interactive)
Finally, we need to serve the actual webpage (HTML) to the user.
# 3. Connect the HTML folder using Jinja2
templates = Jinja2Templates(
    directory=BASE_DIR / "templates"
)
What this does:
Jinja2Templates: This is a template engine. It simply points FastAPI to yourtemplatesfolder so it knows where to find your webpage layout.
The Final Result: By writing these few lines, FastAPI now knows exactly where to find all three critical frontend pieces to build your UI:
templates/index.html(The structure)static/styles.css(The paint and styling)static/app.js(The brain of the frontend)
Serve the Dashboard Page (HTML vs. Data)
Our very first FastAPI endpoint is beautifully simple. Its only job is to load the blank webpage layout.
@app.get("/", response_class=HTMLResponse)
def dashboard(request: Request):
    return templates.TemplateResponse(
        request=request,
        name="index.html",
        context={},
    )
What is happening here?
@app.get("/"): When a user visits[http://127.0.0.1:8000/](http://127.0.0.1:8000/)in their browser, they send a standardGET /request. This line catches that request.response_class=HTMLResponse: Tells FastAPI that we are returning a web page, not raw JSON data.templates.TemplateResponse(...): Takes therequestand serves theindex.htmlfile we connected earlier. Thecontext={}is empty because we aren’t passing any backend variables directly into the HTML yet.
When the browser loads this page, it does not have the 100-review analytics yet. The charts and tables will be completely empty.
Why? Because in modern web architecture, loading the screen and loading the data happen in two separate steps. This is a crucial concept to understand:
GET /➔ “Give me the dashboard interface (HTML structure).”GET /api/dashboard➔ “Give me the actual AI analytics data (JSON) to fill the charts.”
By keeping the UI and the data completely separate, your dashboard loads instantly for the user, and the heavy AI data fetches quietly in the background!
The Endpoint That Feeds Every Dashboard Widget
Here is the historical analytics endpoint:
Only two lines. But those two lines connect almost the entire project.
Follow the journey carefully.
Step 1 — Browser requests data
Step 2 — FastAPI receives it
Step 3 — Read Part 1 output
Step 4 — Get validated objects
Step 5 — Transform them
Step 6 — FastAPI serializes the returned dictionary as JSON
Conceptually:
Now our Python data has crossed into the browser world.
How JSON Actually Becomes a Dashboard Widget
This is the missing link most tutorials skip: How does Python AI data actually appear on a web page?
Open your static/app.js file. The browser pulls data from our backend using the JavaScript Fetch API:
// 1. Browser asks FastAPI for the data
const response = await fetch("/api/dashboard");

// 2. The JSON response becomes a usable JavaScript object
const dashboardData = await response.json();
The Journey of a Single Data Point (Total Reviews) :
Let’s watch exactly how a single metric travels from our backend AI analysis directly to your screen.
1. The Python Backend calculates the number:
"total_reviews": len(results)
2. The FastAPI Endpoint sends it over the web as structured JSON:
{
  "summary": {
    "total_reviews": 100
  }
}
3. The Frontend JavaScript targets the HTML by its ID and injects the data:
document.getElementById("totalReviews").textContent = dashboardData.summary.total_reviews;
4. The HTML DOM updates live for the user to see:
<div class="metric-value" id="totalReviews">100</div>
The Complete Data Flow :
100 FinalAnalysis Records (Python) ➔ FastAPI JSON Response ➔ JavaScript Object ➔ HTML Dashboard Widget
Takeaway: There is no AI magic here. Building a production AI dashboard is simply passing well-structured data cleanly across architectural layers.
How Python AI Data Becomes a Web Chart
How do we turn raw LangGraph agent outputs into a beautiful dashboard widget? The secret is simple data mapping.
Remember our backend Python object? We use Counter() to extract and aggregate the sentiment from all 100 results:
# 1. Python Backend Aggregation
sentiment = Counter(
    x.sentiment.sentiment for x in results
)

# This creates a simple dictionary:
# { "negative": 59, "neutral": 23, "positive": 18 }
FastAPI serves this exact dictionary as JSON. Next, our frontend JavaScript receives it:
// 2. JavaScript receives the FastAPI JSON
const data = dashboardData.sentiment;
Then, we feed this directly into Chart.js, which expects arrays for both labels and data:
// 3. Chart.js Data Mapping
labels: [
    "Negative",
    "Neutral",
    "Positive"
],
data: [
    data.negative || 0,
    data.neutral || 0,
    data.positive || 0
]
The Complete Data Pipeline:
Agent Results (100 individual records)
⬇️ Extracted via
Counter()Aggregated Counts (59 / 23 / 18)
⬇️ Served via
FastAPI JSON
⬇️ Fetched via
JavaScript
⬇️ Rendered by
Chart.js Doughnut Chart
Priority and department charts use exactly the same principle. Once you master this single widget data flow, you understand almost the entire analytics frontend.
The Review Explorer Uses the Same Data Differently
Charts need aggregated counts. The table needs individual records.
That is why dashboard_service.py also creates:
For each analysis:
Before that, results are ranked:
So critical customers naturally appear first.
JavaScript receives:
and creates table rows. That gives us:
The search and dropdown filters happen in the browser, so filtering does not require another LLM call.
Again:
Don’t use AI for work normal software can perform perfectly.
The AI Pipeline: Browser ➔ FastAPI ➔ LangGraph
Everything we have visualized so far was historical data. Now, let’s analyze brand-new feedback in real-time.
When a user types a new complaint (e.g., “The app crashes whenever I upload a PDF…”) and clicks “Run 4-Agent Analysis”, a completely new pipeline begins.
Because the browser is sending data to the backend, our JavaScript fires a POST request:
// Send the live feedback to the FastAPI backend
const response = await fetch("/api/analyze", {
    method: "POST",
    headers: { "Content-Type": "application/json" },
    body: JSON.stringify({ feedback: text }),
});
The Request Payload: { "feedback": "The app crashes whenever..." }
Validating Live Inputs with FastAPI and Pydantic
How does FastAPI safely receive this incoming JSON? We use a Pydantic model to strictly validate the browser’s input before it ever touches our AI:
# 1. Enforce strict character limits to prevent empty inputs or spam
class LiveFeedbackRequest(BaseModel):
    feedback: str = Field(min_length=5, max_length=5000)

# 2. Define the POST endpoint
@app.post("/api/analyze")
def analyze_feedback(payload: LiveFeedbackRequest):
FastAPI automatically validates the incoming request against LiveFeedbackRequest. So even before LangGraph runs, the data flow is strictly controlled:
Browser JSON ➔ FastAPI ➔ Pydantic Validation ➔
payload.feedback
Next, we generate a unique tracking ID for this live session (e.g., LIVE-A7C91F):
# Generate a random 6-character UUID
customer_id = f"LIVE-{uuid.uuid4().hex[:6].upper()}"
And now comes the single most important line of code in Part 2…
FastAPI Calls the LangGraph Workflow
Inside the endpoint:
Stop here. This is where the web application enters the AI graph.
Input:
becomes the same FeedbackState we learned in Part 1.
LangGraph then follows our existing graph:
All four inspect the same feedback.
They update:
Then Fan-In waits for the required branches and calls the aggregator.
FastAPI did not become an AI agent. Its job is orchestration at the application boundary:
That is the clean relationship between FastAPI and LangGraph in this project.
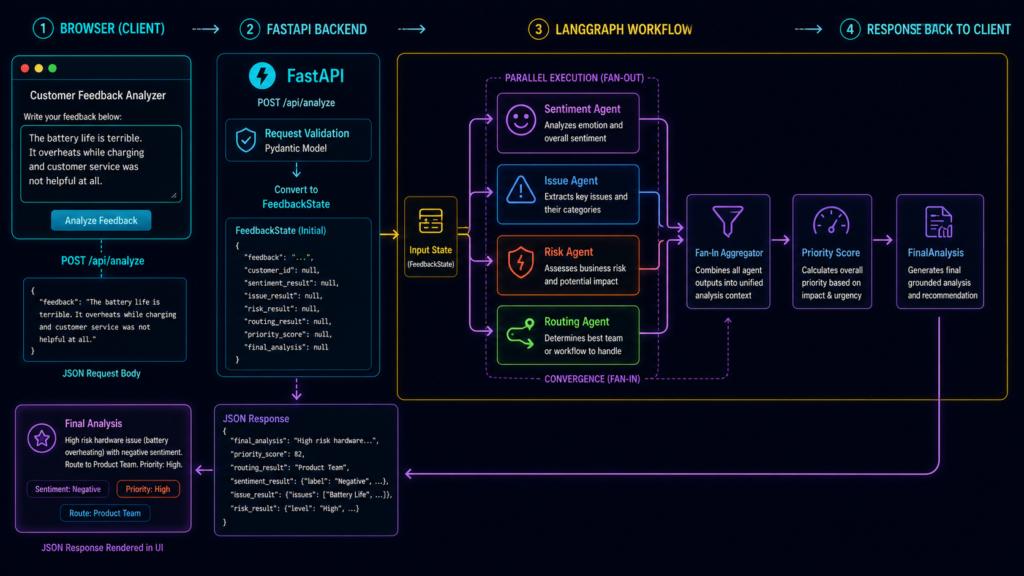
How FinalAnalysis Returns to the Browser
After LangGraph finishes:
Remember where that came from?
The aggregator created it in Part 1.
So FastAPI now has our Pydantic object:
We return:
Pydantic converts the model into a normal Python dictionary.
FastAPI serializes that dictionary into JSON.
The browser receives something like:
Now JavaScript calls:
And accesses nested values such as:
Each value goes into its corresponding result box.
So the complete transformation is:
That is the entire application.
Why We Have Two API Endpoints
At this point the architecture becomes very clean.
Historical analytics
No Groq calls.
No agents.
The expensive AI work already happened during batch processing.
Live intelligence:
This separation is important for both performance and cost.
Imagine refreshing the dashboard ten times.
Should that rerun 400 LLM calls every time?
Absolutely not.
Historical results are stored once and visualized repeatedly.
Only genuinely new feedback needs AI inference.
Start the Dashboard
run_dashboard.py is intentionally tiny:
Run:
Open:
FastAPI also automatically provides interactive API documentation:
You can test /api/analyze directly there without using the dashboard UI.
We also created:
So:
returns:
A tiny endpoint, but useful for checking whether the application itself is alive.
One Important Gotcha: Why Your Dashboard May Show Zero
If the page loads but shows:
FastAPI is probably working perfectly.
Look back at:
If:
does not exist in the dashboard project, load_analyzed_reviews() returns an empty list.
Therefore:
The solution is not to unnecessarily spend another 400 Groq calls.
Use the analyzed_reviews.jsonl already generated in Part 1.
This also teaches an important architectural lesson:
The dashboard is a consumer of analyzed data, not the thing responsible for regenerating the entire dataset every time it starts.
What We Actually Built
Look at how far the same customer review now travels:
The most important lesson is not how to make a glowing chart.
It is learning how to maintain clean data contracts between layers.
LangGraph produces FinalAnalysis.
FastAPI exposes that result.
JavaScript consumes predictable JSON.
Widgets render specific fields.
Every layer knows exactly what it receives and what it should return.
From AI Demo to AI Application
In Part 1, we learned multi-agent orchestration:
In Part 2, we learned how to turn that orchestration into an application:
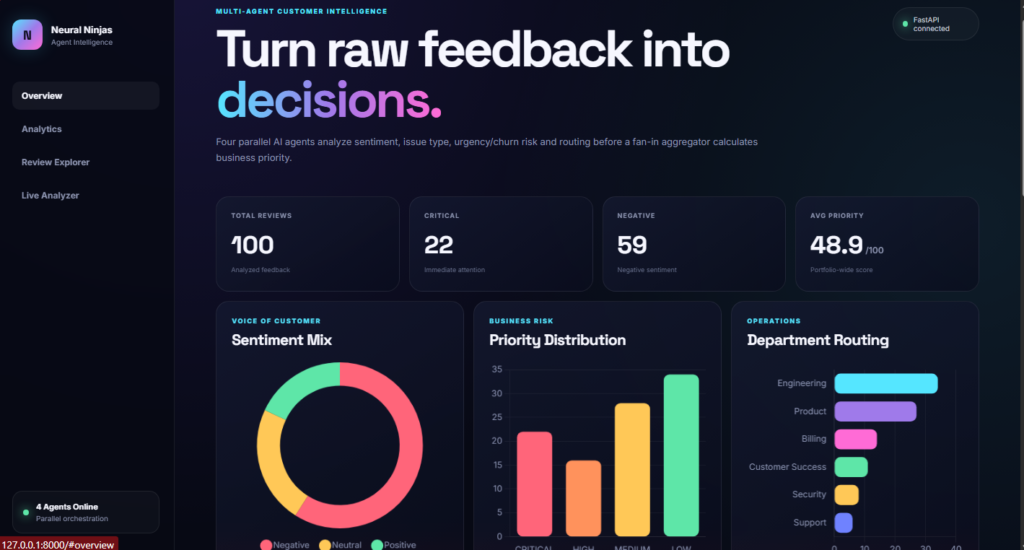
And that distinction matters.
A terminal demo proves that your AI logic works.
An application makes that intelligence usable by someone who has never heard of StateGraph, Pydantic, Groq, or Python.
Our final system can now do both.
It can process 100 customer reviews in batch, transform them into structured intelligence, rank critical customers, visualize sentiment and operational patterns—and accept a completely new customer complaint from the browser and send it through four parallel AI specialists in real time.
All using the same LangGraph backend we built in Part 1.
That is the architecture worth remembering:
Build the intelligence once. Then expose it through whatever interface your users actually need.
Today that interface is a FastAPI customer intelligence dashboard.
Tomorrow the same graph could sit behind a mobile app, Slack bot, CRM integration, internal support platform, or automated escalation system.
The UI can change.
The orchestration does not have to.
The complete source-code folder accompanying Part 2 contains the FastAPI application, dashboard service, HTML template, CSS, JavaScript, existing LangGraph backend, and the same project structure used throughout this tutorial.


[…] Coming in Part 2: We will connect this multi-agent backend to a full-stack FastAPI Customer Intelligence Dashboard […]