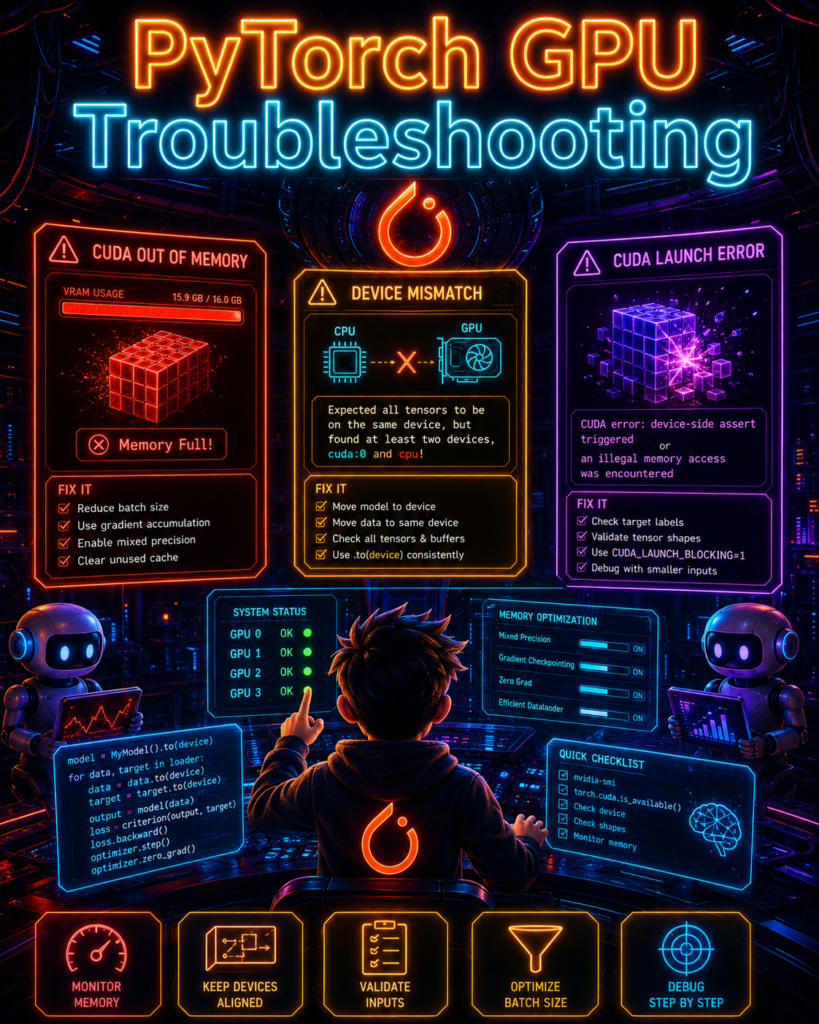
Stop wasting hours on PyTorch GPU errors! Learn to fix CUDA out of memory, device mismatch, and torch.cuda.is_available() with real code, debugging flows, and production-tested solutions.
Table of Contents
The Three Errors That Will Haunt You
What’s Actually Happening Inside Your GPU?
Active Memory vs Cached Memory (The Confusion Killer)
PyTorch 2.x Memory Tools (The Game Changer)
The Graph Leak Nobody Notices
The Complete OOM-Proof Validation Loop
The Dynamic Device Anchoring Pattern
Advanced Memory Tactics That Actually Work
AMP: When It Saves You and When It Backfires
Gradient Checkpointing: The Memory-Compute Tradeoff
The OOM Diagnosis Flow (With Visual)
Why torch.cuda.is_available() is False
The Clean Reinstall Rule
Multi-GPU DDP: From Basic to Battle-Tested
NCCL Issues Deep Dive
Myths vs Reality
The 5-Minute Debugging Cheat Sheet
Best-Practice Checklist
FAQs
The Bottom Line
1. The Three Errors That Will Haunt You
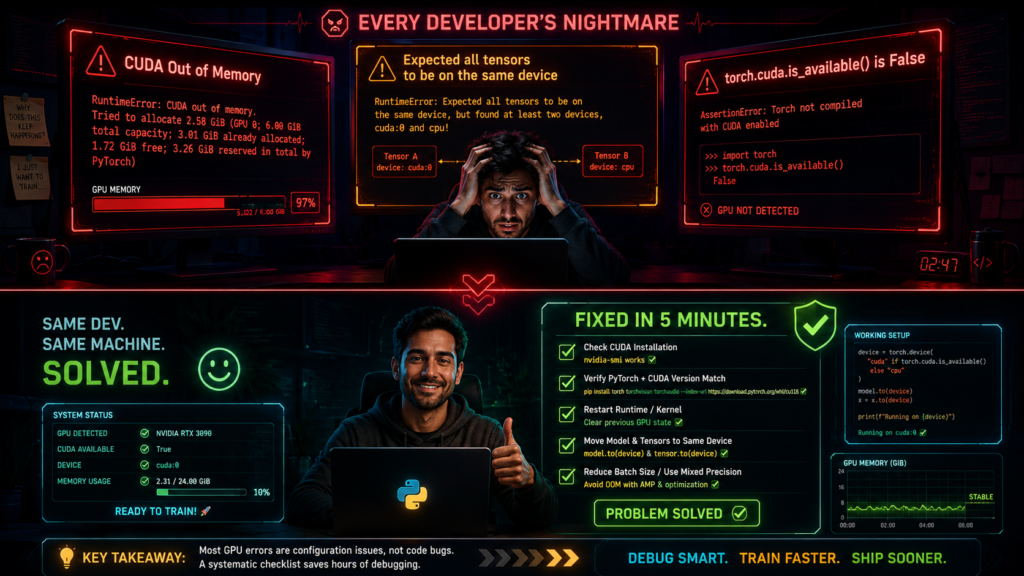
If you work with PyTorch long enough, these three errors will eventually hit you:
CUDA out of memory – Your GPU ran out of VRAM
Expected all tensors to be on the same device – CPU and GPU tensors fighting
torch.cuda.is_available() is False – PyTorch can’t see your GPU
They stop training, break demos, and waste hours. This guide is not a beginner tutorial. It is a practical debugging manual you can bookmark and use when things go wrong.
2. What’s Actually Happening Inside Your GPU?
To debug OOM properly, you need to understand what PyTorch does with memory.
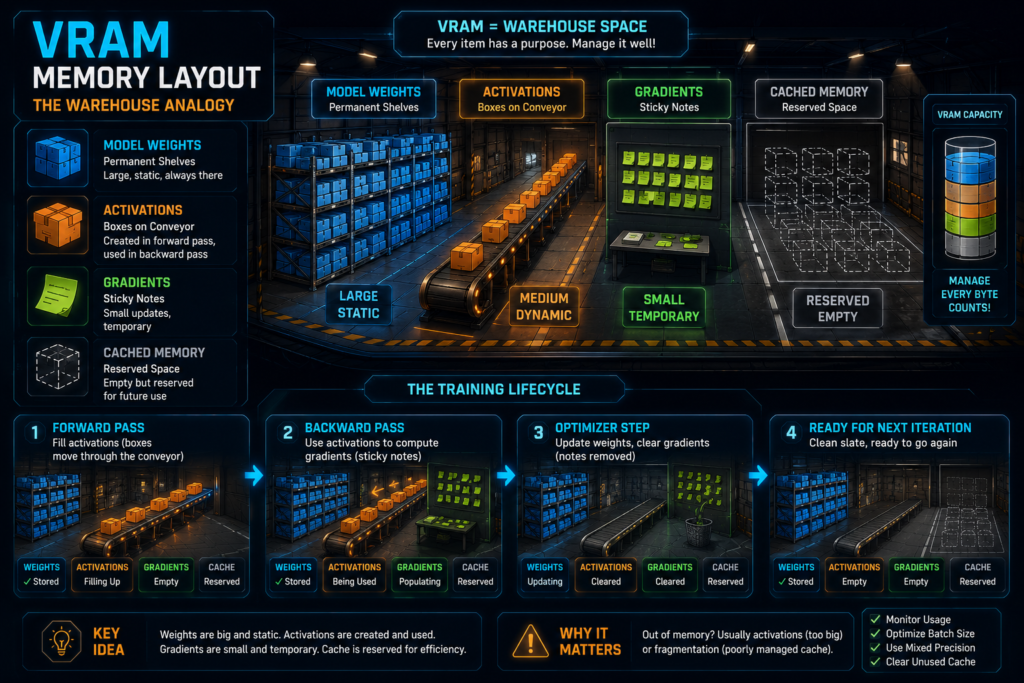
The VRAM Lifecycle
forward()  → activations are stored
backward() → gradients are computed
optimizer.step() → weights are updated
What actually happens:
Forward Pass: PyTorch runs your model and stores intermediate activations because it needs them for backpropagation
Backward Pass: PyTorch computes gradients using those stored activations
Optimizer Step: PyTorch updates the model weights
The critical insight: During the forward pass, PyTorch stores intermediate activations because it needs them for backpropagation. If those activations stay attached to the graph longer than they should, memory usage grows batch after batch.
The Visual Mental Model
Imagine VRAM as a warehouse:
Model Weights = Heavy machinery (always there)
Activations = Work-in-progress items (cleared after each batch)
Gradients = Temporary notes (cleared after optimizer step)
Cached Memory = Empty space PyTorch keeps reserved (not truly free)
3. Active Memory vs Cached Memory
This is where many people get confused.
Active Memory = tensors currently in use
Cached Memory = memory PyTorch has reserved for later
What this means:
When you see memory still reserved after an operation, that does not always mean you have a leak. It may just be PyTorch caching memory for faster reuse.
Why torch.cuda.empty_cache() is Misunderstood
torch.cuda.empty_cache() # Often used, rarely fixes real OOM
The truth: torch.cuda.empty_cache() can release unused cached memory, but it does not free active tensors that your program still needs.
When it works: When memory is fragmented and you need to consolidate.
When it fails: When you actually have active tensors taking up space.
Example:
# This doesn't fix OOM if you have active tensors
model = MyBigModel().cuda()
data = torch.randn(1000, 1000, 1000).cuda()  # Active!
torch.cuda.empty_cache()  # Still OOM because data is still there
4. PyTorch 2.x Memory Tools (The Game Changer)
PyTorch 2.x introduced powerful memory debugging tools that most people don’t know about. These are game-changers for OOM debugging.
Tool 1: Memory History Recording
import torch

# Enable memory history recording
torch.cuda.memory._record_memory_history()

# Run your code
model = MyModel().cuda()
output = model(inputs)
loss = criterion(output, targets)
loss.backward()

# Dump memory history
torch.cuda.memory._dump_snapshot("memory_snapshot.pickle")

# Disable recording
torch.cuda.memory._record_memory_history(enabled=None)
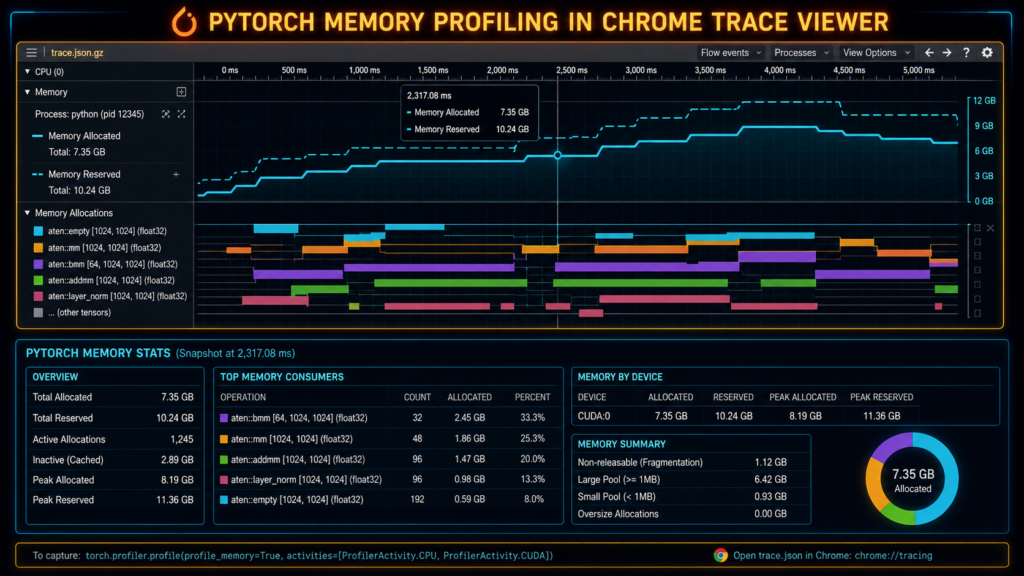
What this does: Records every memory allocation, freeing, and tensor creation. You can visualize this in Chrome’s trace viewer.
Tool 2: Memory Profiler Context
from torch.cuda import memory

# Profile a specific code block
with memory.profile(True):
    # Your code here
    model = MyModel().cuda()
    output = model(inputs)

# Print memory profile
print(memory.memory_stats())
Tool 3: Peak Memory Tracking
# Reset peak memory stats
torch.cuda.reset_peak_memory_stats()

# Run your code
model = MyModel().cuda()
output = model(inputs)
loss = criterion(output, targets)
loss.backward()

# Get peak memory usage
peak_memory = torch.cuda.max_memory_allocated() / 1024**3
print(f"Peak memory: {peak_memory:.2f} GB")
Tool 4: Detailed Memory Stats
def detailed_memory_report():
    """Get detailed memory stats for debugging"""
    stats = torch.cuda.memory_stats()

    print("=== CUDA Memory Stats ===")
    print(f"Allocated: {stats['allocated_bytes.all.current'] / 1024**3:.2f} GB")
    print(f"Reserved: {stats['reserved_bytes.all.current'] / 1024**3:.2f} GB")
    print(f"Active: {stats['active_bytes.all.current'] / 1024**3:.2f} GB")
    print(f"Inactive: {stats['inactive_bytes.all.current'] / 1024**3:.2f} GB")
    print(f"Peak allocated: {stats['allocated_bytes.all.peak'] / 1024**3:.2f} GB")
    print(f"Fragmentation: {stats['active_bytes.all.current'] / stats['reserved_bytes.all.current']:.2%}")
Visualizing Memory with Chrome
# Dump memory snapshot
torch.cuda.memory._dump_snapshot("memory_snapshot.pickle")

# Open Chrome and go to chrome://tracing/
# Load the pickle file as JSON
# You'll see a visual timeline of memory allocations
5. The Graph Leak Nobody Notices
This line looks innocent:
losses.append(loss) # ❌ DANGER!
But if loss is still attached to the computation graph, you may keep the whole graph alive. Over time, that can make VRAM usage climb until the job crashes.
Safe Version:
losses.append(loss.item())  # ✅ Safe
# Or:
losses.append(loss.detach().cpu().item())  # ✅ Also safe
Why this works: .item() breaks the graph reference and lets memory be freed normally. .detach() removes the tensor from the computation graph.
The Complete Pattern
# ❌ WRONG - Gradually leaks memory
all_losses = []
for batch in dataloader:
    loss = criterion(model(batch), targets)
    all_losses.append(loss)  # Keeps graph alive!
    loss.backward()

# ✅ RIGHT - Memory safe
all_losses = []
for batch in dataloader:
    loss = criterion(model(batch), targets)
    all_losses.append(loss.item())  # Graph reference broken
    loss.backward()
Detecting Graph Leaks with PyTorch 2.x :
# Use memory history to find graph leaks
torch.cuda.memory._record_memory_history()

# Run one training iteration
loss = criterion(model(inputs), targets)
loss.backward()

# Check what tensors are still allocated
stats = torch.cuda.memory_stats()
allocated_tensors = stats['allocated_bytes.all.current']

if allocated_tensors > expected_size:
    print("Possible graph leak detected!")
    # Dump snapshot to visualize
    torch.cuda.memory._dump_snapshot("leak_snapshot.pickle")
6. The Complete OOM-Proof Validation Loop
Validation should never build a graph. Here’s the production-proven pattern:
model.eval()  # Turn off dropout, batch norm uses running stats
total_loss = 0.0

with torch.no_grad():  # CRITICAL: Disable gradient tracking
    for inputs, targets in val_loader:
        # Move to device
        inputs, targets = inputs.to(device), targets.to(device)

        # Forward pass (no graph built!)
        outputs = model(inputs)
        loss = criterion(outputs, targets)

        # Convert to Python number, not tensor
        total_loss += loss.item()  # CRITICAL: No .item() = memory leak!

val_loss = total_loss / len(val_loader)
Why This Works ?
| Component | What It Does | Why It Matters |
|---|---|---|
model.eval() | Turns off dropout, batch norm uses running stats | Prevents training-specific behavior |
torch.no_grad() | Prevents graph tracking | No memory allocated for gradients |
loss.item() | Converts to plain Python number | Graph reference is broken |
.to(device) | Moves tensors to GPU | Prevents device mismatch |
If you skip no_grad() or store raw loss tensors, validation can quietly leak memory and eventually cause OOM.
7. The Dynamic Device Anchoring Pattern
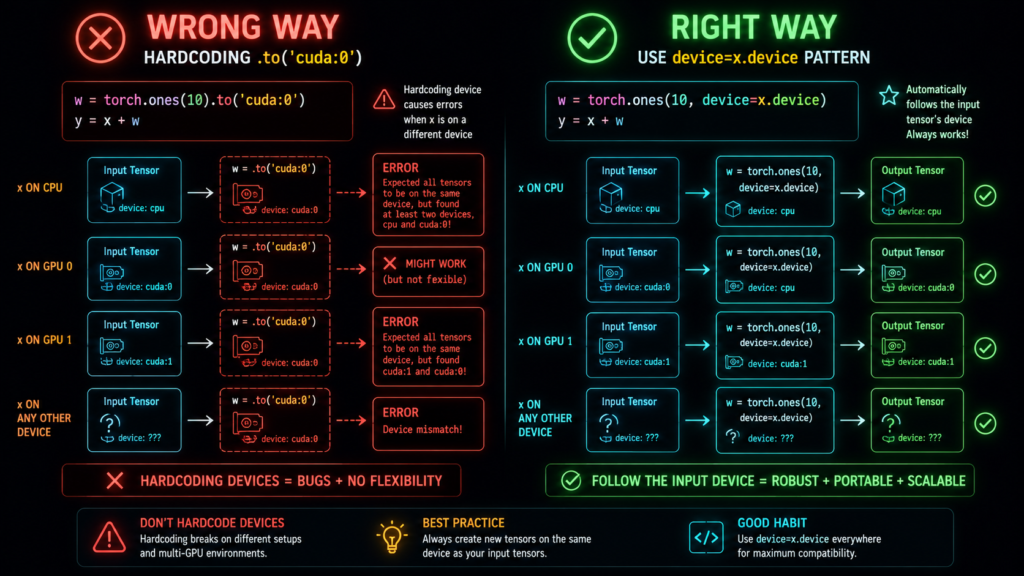
Never hardcode .to("cuda:0") unless you truly mean it.
Why Hardcoding Breaks
# ❌ DANGEROUS - Breaks in multi-GPU and CPU environments
mask = torch.ones_like(x, device="cuda:0")
This breaks:
CPU fallback
Multi-GPU portability
Notebook reuse
Flexible deployment
The Safe Pattern
# ✅ SAFE - Uses whatever device x is on
def forward(self, x):
    mask = torch.ones_like(x, device=x.device)  # Follows x's device
    return x * mask
Why this works: It automatically follows whatever device x is already on. If x is on GPU 0, mask goes to GPU 0. If x is on CPU, mask goes to CPU.
Same Rule for Custom Losses
# ❌ WRONG - Device mismatch waiting to happen
def custom_loss(pred, target):
    return ((pred - target) ** 2).mean()

# ✅ RIGHT - Explicitly align devices
def custom_loss(pred, target):
    target = target.to(pred.device)  # Align with pred's device
    return ((pred - target) ** 2).mean()
Why: If one tensor stays on CPU and the other on GPU, PyTorch will throw the same-device error the moment you do math on them together.
The Complete Device-Safe Pattern
class DeviceSafeModel(nn.Module):
    def forward(self, x):
        # Create tensors that follow x's device
        mask = torch.ones_like(x, device=x.device)

        # Always check device before operations
        if hasattr(self, 'buffer'):
            self.buffer = self.buffer.to(x.device)

        return x * mask + self.buffer
8. Advanced Memory Tactics That Actually Work
If the model still does not fit, you need real memory-saving techniques.
Technique 1: Gradient Accumulation
This simulates a large batch using smaller micro-batches.
Example: Effective batch size 64 using batch size 4 and accumulation steps of 16.
accum_steps = 16  # How many micro-batches to accumulate
optimizer.zero_grad()

for step, (inputs, targets) in enumerate(train_loader):
    inputs, targets = inputs.to(device), targets.to(device)

    # Forward pass with micro-batch
    outputs = model(inputs)
    loss = criterion(outputs, targets) / accum_steps  # Scale loss

    # Backward pass (accumulates gradients)
    loss.backward()

    # Update weights every accum_steps
    if (step + 1) % accum_steps == 0:
        optimizer.step()  # Update weights
        optimizer.zero_grad()  # Reset gradients
Why this works: You’re not storing gradients for the full batch at once. You’re computing them incrementally over multiple micro-batches.
When to use: When you want large effective batch sizes but have limited VRAM.
9. AMP: When It Saves You and When It Backfires
What AMP Actually Does ?
from torch.cuda.amp import autocast, GradScaler

scaler = GradScaler()  # Handles gradient scaling

for inputs, targets in train_loader:
    inputs, targets = inputs.to(device), targets.to(device)
    optimizer.zero_grad()

    # Automatic Mixed Precision
    with autocast():
        outputs = model(inputs)
        loss = criterion(outputs, targets)

    # Scaled backward pass
    scaler.scale(loss).backward()
    scaler.step(optimizer)  # Unscales gradients and updates
    scaler.update()  # Updates scaling factor
Memory savings: 30-50% less memory.
Speed: Usually 2-3x faster on compatible GPUs.
When AMP Works Great
✅ Compute Capability ≥ 7.0 (Volta, Turing, Ampere, Hopper)
✅ Training large models
✅ When memory is the primary constraint
✅ When you can tolerate slight accuracy drops
When AMP Backfires (Hard)
1. On Older GPUs (Compute Capability < 7.0)
# Check your compute capability
compute_capability = torch.cuda.get_device_properties(0).major
if compute_capability < 7:
    print("AMP will be SLOWER on this GPU!")
    # FP16 ops are emulated, not hardware-accelerated
2. With Numerical Instability
# Some operations are unstable in FP16
# Common culprits:
# - Softmax with large values
# - Log operations
# - Operations with very small gradients

# Solution: Use autocast only on stable operations
with autocast():
    # Only put numerically stable ops in autocast
    output = model(inputs)
    # For unstable ops, cast manually
    loss = criterion(output.float(), targets.float())
3. With Gradient Scaling Issues
# If you see NaN or Inf losses
scaler = GradScaler()
for batch in dataloader:
    with autocast():
        output = model(inputs)
        loss = criterion(output, targets)

    scaler.scale(loss).backward()

    # Skip bad gradients
    if scaler._scale is not None:
        scaler.step(optimizer)
        scaler.update()
    else:
        optimizer.zero_grad()  # Skip step
        continue  # Skip this batch
AMP Performance Check
import time

def benchmark_amp(model, dataloader):
    # Without AMP
    start = time.time()
    for batch in dataloader:
        output = model(batch)
        loss = criterion(output, targets)
        loss.backward()
    no_amp_time = time.time() - start

    # With AMP
    scaler = GradScaler()
    start = time.time()
    for batch in dataloader:
        with autocast():
            output = model(batch)
            loss = criterion(output, targets)
        scaler.scale(loss).backward()
        scaler.step(optimizer)
        scaler.update()
    amp_time = time.time() - start

    print(f"Without AMP: {no_amp_time:.2f}s")
    print(f"With AMP: {amp_time:.2f}s")
    print(f"Speedup: {no_amp_time/amp_time:.2f}x")
10. Gradient Checkpointing: The Memory-Compute Tradeoff
What It Does
Checkpointing saves memory by discarding some activations and recomputing them during backward pass.
from torch.utils.checkpoint import checkpoint

class CheckpointedBlock(nn.Module):
    def forward(self, x):
        # This function defines the forward pass to checkpoint
        def custom_forward(x):
            return self.block(x)

        # Checkpoint saves memory by recomputing during backward
        return checkpoint(custom_forward, x)
Memory savings: Up to 60% reduction in activation memory.
Speed trade-off: Adds ~20-30% compute overhead.
When to Use Checkpointing
# ✅ GOOD - Large model with memory constraint
class BigModel(nn.Module):
    def __init__(self):
        self.encoder = Encoder()  # Large encoder
        self.decoder = Decoder()  # Large decoder

    def forward(self, x):
        # Checkpoint the expensive parts
        x = checkpoint(self.encoder, x)
        x = checkpoint(self.decoder, x)
        return x
When It Backfires
1. With Small Models
# ❌ BAD - Overhead > benefit
class TinyModel(nn.Module):
    def forward(self, x):
        # Checkpoint overhead is bigger than memory saved
        return checkpoint(self.small_block, x)  # Wastes time!
2. With Custom Backward Functions
# ❌ WRONG - Can't checkpoint custom backward
def custom_forward(x):
    return my_complex_op(x)

# This will fail if my_complex_op has custom gradient
out = checkpoint(custom_forward, x)  # Might break!
3. With Memory-Bound Operations
# ❌ BAD - Operation is already memory-bound
# If the operation is slow due to memory bandwidth,
# recomputing makes it even slower
Checkpointing Best Practices
# ✅ Optimal checkpointing
class OptimalModel(nn.Module):
    def forward(self, x):
        # Checkpoint only expensive blocks
        x = checkpoint(self.block1, x)  # Expensive, checkpoint
        x = self.block2(x)  # Cheap, don't checkpoint
        x = checkpoint(self.block3, x)  # Expensive, checkpoint
        x = self.block4(x)  # Cheap, don't checkpoint
        return x
11. The OOM Diagnosis Flow
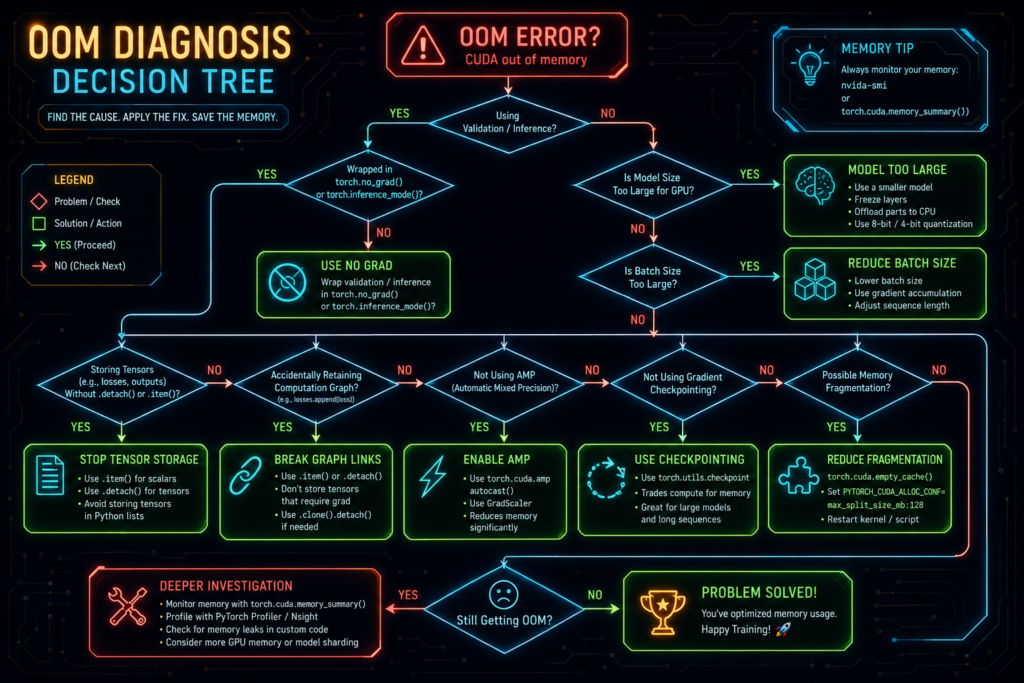
Before changing code randomly, ask these questions:
The OOM Decision Tree
Is the model too large for the GPU?
├── Yes → Use smaller model or gradient checkpointing
└── No → Continue

Is batch size too high?
├── Yes → Reduce batch size or use gradient accumulation
└── No → Continue

Are you retaining graphs accidentally?
├── Yes → Use .item() and .detach()
└── No → Continue

Is validation missing torch.no_grad()?
├── Yes → Add torch.no_grad()
└── No → Continue

Are tensors being stored in Python lists?
├── Yes → Store as scalars with .item()
└── No → Continue

Is memory fragmented?
├── Yes → Try torch.cuda.empty_cache() or restart
└── No → Continue

Would AMP or checkpointing help?
├── Yes → Implement them
└── No → Consider upgrading hardware
The Quick Diagnostic Script
def diagnose_gpu_memory():
    print(f"GPU available: {torch.cuda.is_available()}")
    if torch.cuda.is_available():
        print(f"GPU count: {torch.cuda.device_count()}")
        print(f"Current GPU: {torch.cuda.current_device()}")
        print(f"GPU name: {torch.cuda.get_device_name()}")

        # Memory stats
        allocated = torch.cuda.memory_allocated() / 1024**3
        reserved = torch.cuda.memory_reserved() / 1024**3
        max_allocated = torch.cuda.max_memory_allocated() / 1024**3

        print(f"Allocated: {allocated:.2f} GB")
        print(f"Reserved (cached): {reserved:.2f} GB")
        print(f"Max allocated: {max_allocated:.2f} GB")
        print(f"Total VRAM: {torch.cuda.get_device_properties(0).total_memory / 1024**3:.2f} GB")

diagnose_gpu_memory()
12. Why torch.cuda.is_available() is False ?
This is the cleanest way to debug GPU detection problems.
The Diagnostic Flowchart
Step 1: Run nvidia-smi
   ├─ fails → Driver problem
   └─ works → Continue

Step 2: Check torch.__version__
   ├─ contains +cpu → Wrong wheel
   └─ CUDA wheel → Continue

Step 3: Print torch.version.cuda
   ├─ None → No CUDA-enabled PyTorch
   └─ version shown → Continue

Step 4: Test a CUDA tensor
   ├─ fails → Deeper CUDA/PyTorch mismatch
   └─ works → Your model code is the issue
Step 1: Check the Driver
nvidia-smi
If this fails, the NVIDIA driver is the first thing to fix. PyTorch cannot use a GPU the system itself cannot see.
Step 2: Check the PyTorch Build
import torch
print(torch.__version__)
If the version includes +cpu, you installed the CPU-only build. That wheel will never use CUDA.
Example outputs:
2.0.0+cpu→ ❌ CPU-only, will never see GPU2.0.0+cu118→ ✅ CUDA 11.8 build
Step 3: Check CUDA Support Inside PyTorch
import torch
print(torch.version.cuda)
If this is None, your current installation does not include CUDA support.
Step 4: Test a Real CUDA Tensor
import torch
x = torch.ones(1, device="cuda")
print(x)
If this fails, the issue is not your training loop. It is the environment.
13. The Clean Reinstall Rule
When the environment is broken, the best move is often a clean reinstall using the official PyTorch selector.
The Safe Reinstall Process
# Step 1: Remove conflicting installs
pip uninstall torch torchvision torchaudio -y
pip uninstall torch-cuda -y  # If installed

# Step 2: Install the correct CUDA-enabled wheel
# Use the official selector: https://pytorch.org/get-started/locally/
# Example for CUDA 11.8:
pip install torch torchvision torchaudio --index-url https://download.pytorch.org/whl/cu118

# Step 3: Verify
python -c "import torch; print(torch.cuda.is_available())"
# Should print: True

# Step 4: Test a tiny tensor on GPU
python -c "import torch; x = torch.ones(1, device='cuda'); print(x)"
# Should print: tensor([1.], device='cuda:0')

# Step 5: Run your model
python train.py
Why This Works ?
| Problem | Clean Install Fix |
|---|---|
| CPU-only build | Installs CUDA-enabled wheel |
| Version mismatch | Uses official compatible versions |
| Conflicting packages | Removes all before installing |
| Broken dependencies | Fresh installation resolves |
The One Rule
Mix and match PyTorch versions at your own risk. The official selector exists for a reason.
14. Multi-GPU DDP: From Basic to Battle-Tested
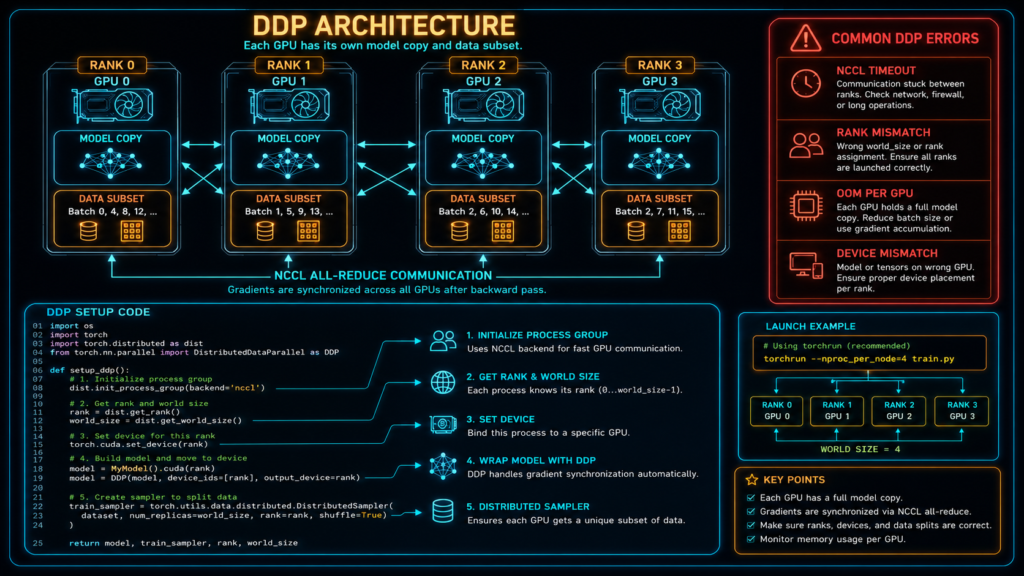
Distributed Data Parallel (DDP) adds its own debugging challenges.
The Production DDP Template
import torch.distributed as dist
from torch.nn.parallel import DistributedDataParallel as DDP
from torch.utils.data.distributed import DistributedSampler
import os

def setup_ddp(rank, world_size):
    """Initialize DDP with proper environment"""
    # Set CUDA device
    torch.cuda.set_device(rank)

    # Initialize process group
    dist.init_process_group(
        backend="nccl",  # Use NCCL for GPU communication
        init_method="env://",  # Use environment variables
        rank=rank,
        world_size=world_size
    )

    # Optional: Set NCCL timeout for large models
    os.environ["NCCL_TIMEOUT"] = "600"  # 10 minutes

def cleanup_ddp():
    """Clean up DDP"""
    dist.destroy_process_group()

# Training with DDP
def train_ddp(rank, world_size):
    setup_ddp(rank, world_size)

    # Model wrapped with DDP
    model = MyModel().cuda(rank)
    model = DDP(model, device_ids=[rank])

    # DataLoader with DistributedSampler
    sampler = DistributedSampler(
        dataset,
        num_replicas=world_size,
        rank=rank,
        shuffle=True
    )
    dataloader = DataLoader(
        dataset,
        batch_size=32,
        sampler=sampler,
        num_workers=4,
        pin_memory=True
    )

    for epoch in range(epochs):
        sampler.set_epoch(epoch)  # CRUCIAL: Different shuffling per epoch

        for batch in dataloader:
            # Training loop
            pass

    cleanup_ddp()

# Launch with torchrun
# torchrun --nproc_per_node=4 train.py
Common DDP Errors and Solutions
| Error | Cause | Fix |
|---|---|---|
NCCL timeout | Communication issue | Increase timeout: os.environ["NCCL_TIMEOUT"] = "600" |
Rank mismatch | Wrong number of GPUs | Set --nproc_per_node correctly |
CUDA out of memory on DDP | Each GPU gets its own model copy | Reduce batch size per GPU |
Device mismatch in DDP | Tensors not on correct device | Use rank to set device: .cuda(rank) |
NCCL error: unhandled system error | Network issues | Check network, reduce num_workers |
Process group not initialized | Missing init_process_group | Call before using DDP |
DDP Memory Debugging
# Check memory per GPU in DDP
def log_ddp_memory(rank):
    if rank == 0:  # Only log from main process
        print(f"GPU {rank}: {torch.cuda.memory_allocated(rank) / 1024**3:.2f} GB")
        print(f"Peak: {torch.cuda.max_memory_allocated(rank) / 1024**3:.2f} GB")

# Use in training loop
log_ddp_memory(rank)
15. NCCL Issues Deep Dive
NCCL (NVIDIA Collective Communications Library) issues are some of the most frustrating DDP problems. Here’s how to fix them.
Common NCCL Errors
# Error 1: Timeout
RuntimeError: NCCL error: unhandled system error, NCCL version 2.12.10

# Error 2: Network issues
RuntimeError: NCCL error: network error, NCCL version 2.12.10

# Error 3: Resource exhaustion
RuntimeError: NCCL error: out of resources, NCCL version 2.12.10
NCCL Environment Variables That Save Lives
import os

# 1. Increase timeout (for large models)
os.environ["NCCL_TIMEOUT"] = "600"  # 10 minutes

# 2. Force network interface (if multiple interfaces)
os.environ["NCCL_IB_DISABLE"] = "1"  # Disable InfiniBand
os.environ["NCCL_SOCKET_IFNAME"] = "eth0"  # Use eth0 interface

# 3. Reduce memory usage
os.environ["NCCL_P2P_DISABLE"] = "1"  # Disable peer-to-peer
os.environ["NCCL_IB_DISABLE"] = "1"  # Disable InfiniBand

# 4. Debug mode (for troubleshooting)
os.environ["NCCL_DEBUG"] = "INFO"  # Or "WARN", "ERROR"
os.environ["NCCL_DEBUG_SUBSYS"] = "ALL"  # Debug all subsystems

# 5. Async error handling
os.environ["NCCL_ASYNC_ERROR_HANDLING"] = "1"
NCCL Debugging Checklist
# 1. Check NCCL version
python -c "import torch; print(torch.distributed.is_nccl_available())"

# 2. Check network connectivity between nodes
# For multi-node training, ping between nodes

# 3. Check GPU compatibility
nvidia-smi --query-gpu=compute_cap --format=csv

# 4. Check NCCL environment variables
env | grep NCCL

# 5. Test with minimal DDP example
# Start with single node, single GPU
# Then single node, multiple GPUs
# Then multi-node
16. Myths vs Reality
This is the kind of truth that saves debugging time.
| Myth | Reality |
|---|---|
torch.cuda.empty_cache() frees VRAM for a bigger batch | It only releases unused cached memory; active tensors still occupy VRAM |
| OOM always means a bug in PyTorch | Usually it is batch size, graph retention, model size, or fragmentation |
| CPU PyTorch can still use CUDA if the driver exists | No, you need a CUDA-enabled PyTorch wheel |
losses.append(loss) is harmless | It can keep the graph alive and slowly leak memory |
| Device mismatch means the model is broken | Often one tensor, mask, or new tensor was created on the wrong device |
| Mixed precision is always faster | Can be slower on older GPUs (Compute Capability < 7.0) |
| Gradient accumulation doubles training time | It keeps training time roughly the same (same effective batch size) |
| More GPUs always means faster training | Diminishing returns after 4-8 GPUs due to communication overhead |
| NCCL errors mean network is broken | Often timeout or resource exhaustion, fixable with env vars |
| PyTorch 2.x is slower than 1.x | Usually faster, but may need optimization for new features |
The One That Hurts Most
“I set batch size to 64, but I only have 6GB VRAM. Why is it failing?”
Because 64 is the effective batch size. With gradient accumulation, you can use batch size 4 with 16 accumulation steps. Same effective batch, 4x less VRAM.
17. The 5-Minute Debugging Cheat Sheet
When things go wrong, run through this checklist in order.
Minute 1: CUDA OOM
# 1. Check what's using memory
import torch
print(f"Allocated: {torch.cuda.memory_allocated() / 1024**3:.2f} GB")
print(f"Cached: {torch.cuda.memory_reserved() / 1024**3:.2f} GB")

# 2. Check graph retention
# Look for .backward() without .detach()
# Look for losses.append(loss) instead of .item()

# 3. Reduce batch size temporarily to verify
batch_size = batch_size // 2  # Test if this fixes it

# 4. Add torch.no_grad() to validation
with torch.no_grad():
    # validation loop

# 5. If nothing works, use gradient accumulation
Minute 2: Device Mismatch
# 1. Find the offending tensors
print(f"Model device: {next(model.parameters()).device}")
print(f"Input device: {inputs.device}")
print(f"Target device: {targets.device}")

# 2. The fix - align everything
inputs, targets = inputs.to(device), targets.to(device)

# 3. Use device anchoring in your model
def forward(self, x):
    mask = torch.ones_like(x, device=x.device)
    return x * mask

# 4. Check custom losses
def custom_loss(pred, target):
    target = target.to(pred.device)
    return ((pred - target) ** 2).mean()
Minute 3: CUDA Not Available
# 1. Check if NVIDIA driver exists
nvidia-smi

# 2. Check PyTorch build
python -c "import torch; print(torch.__version__)"

# 3. Check CUDA support
python -c "import torch; print(torch.version.cuda)"

# 4. Test tensor creation
python -c "import torch; x = torch.ones(1, device='cuda'); print(x)"

# 5. If all fails, clean reinstall
pip uninstall torch torchvision torchaudio -y
pip install torch torchvision torchaudio --index-url https://download.pytorch.org/whl/cu118
Minute 4: Memory Leaks
# 1. Check for stored graph references
# Search for: losses.append(loss)  → Change to .item()

# 2. Check for validation without no_grad()
# Search for: model.eval()  → Ensure torch.no_grad() follows

# 3. Check for detach() in custom code
# If you have custom gradients, ensure you're not keeping references

# 4. Use PyTorch 2.x memory tools
torch.cuda.memory._record_memory_history()
# Run one batch
torch.cuda.memory._dump_snapshot("leak_snapshot.pickle")
Minute 5: The Nuclear Option
# 1. Clear everything
torch.cuda.empty_cache()
torch.cuda.reset_peak_memory_stats()

# 2. Restart kernel/notebook
# Sometimes fragmentation requires a full restart

# 3. If still failing, restart the system
# GPU memory might be stuck from crashed processes

# 4. Check for other processes using GPU
# nvidia-smi → Look for other processes, kill them

# 5. For DDP NCCL issues
os.environ["NCCL_TIMEOUT"] = "600"
os.environ["NCCL_DEBUG"] = "INFO"
18. Best-Practice Checklist
Before Training
- Verify GPU with
nvidia-smi - Verify PyTorch CUDA build with
torch.cuda.is_available() - Check VRAM available vs model requirements
- Set appropriate batch size for your VRAM
- Configure gradient accumulation if needed
- Enable PyTorch 2.x memory tools for debugging
During Training Loop
- Use
model.train()for training,model.eval()for validation - Use
torch.no_grad()for validation - Convert scalar tensors with
.item() - Keep tensors on same device using
x.device - Use
detach()for tensors you want to free - Monitor memory usage with
torch.cuda.memory_stats()
Model Definition
- No hardcoded
.to("cuda:0")in model - All custom tensors use
device=x.device - Custom losses align devices
Memory Management
- Use AMP (mixed precision) when possible
- Test AMP with your specific GPU (Compute Capability ≥ 7.0)
- Use gradient checkpointing for large models
- Use gradient accumulation for large effective batches
- Monitor memory usage with
torch.cuda.memory_allocated()
Multi-GPU DDP
- Use
DistributedSamplerwith DDP - Set
sampler.set_epoch(epoch)in DDP - Handle rank-specific device setup
- Monitor NCCL communication
- Set NCCL environment variables for stability
- Test single GPU before multi-GPU
19. FAQs
Q: Why does OOM happen on one batch but not the previous identical batch?
A: Memory fragmentation. As you allocate and free memory, gaps appear. Use gradient accumulation with smaller batches or restart the kernel.
Q: Why does PyTorch memory not reduce after deleting tensors?
A: PyTorch caches memory for performance. Use torch.cuda.empty_cache() to release cached memory, but remember it won’t free active tensors.
Q: How much VRAM does my model actually need?
A: Rough estimate: model_size + batch_size * activation_size + optimizer_state + gradients. Use torch.cuda.max_memory_allocated() to measure.
Q: What are PyTorch 2.x memory tools and how do I use them?
A: torch.cuda.memory._record_memory_history() records all allocations. torch.cuda.memory._dump_snapshot() visualizes memory in Chrome’s trace viewer. Use these to find graph leaks and memory hotspots.
Q: Why does device mismatch happen in the middle of training?
A: Usually because you created a new tensor (like torch.zeros()) without specifying device. Always specify device or use device anchoring.
Q: Why does saving/loading models cause device mismatch?
A: When you load a model saved on GPU but move it to CPU. Use map_location='cpu' in torch.load().
Q: Why is torch.cuda.is_available() False when nvidia-smi works?
A: You have the CPU-only PyTorch build. Reinstall with CUDA-enabled wheel.
Q: Why does PyTorch show CUDA 11.x but I have CUDA 12.x?
A: PyTorch version is tied to specific CUDA versions. Use the official selector for compatibility.
Q: Why is mixed precision training slower on my GPU?
A: Older GPUs (Compute Capability < 7.0) don’t have efficient FP16 support. Check your compute capability: torch.cuda.get_device_properties(0).major.
Q: Why does gradient accumulation not improve performance?
A: It shouldn’t improve speed, it should reduce memory. Performance stays roughly the same because you’re processing the same effective batch size.
Q: What causes NCCL timeout errors?
A: Usually network issues, too many GPUs, or slow communication. Increase NCCL_TIMEOUT environment variable.
Q: How do I debug NCCL errors?
A: Set NCCL_DEBUG=INFO and NCCL_DEBUG_SUBSYS=ALL to get detailed logs.
20. The Bottom Line
The Core Takeaway
PyTorch debugging gets easier when you stop treating errors as random and start treating them as signals.
OOM usually means memory pressure or graph retention.
Device mismatch usually means a tensor was created on the wrong device.
CUDA unavailable usually means your environment is misinstalled.
NCCL errors usually mean network or resource issues, fixable with env vars.
The Three Golden Rules
Memory: Use
torch.no_grad(),.item(), and.detach()to prevent graph retention. Use PyTorch 2.x memory tools to find leaks.Device: Never hardcode
cuda:0. Usedevice=x.deviceto follow the tensor.Environment: If
torch.cuda.is_available()is False, start with a clean reinstall.
What You’ve Learned
| Concept | What It Does | When to Use |
|---|---|---|
model.eval() | Disables dropout, uses running stats | Before validation |
torch.no_grad() | Disables gradient computation | During validation, inference |
.item() | Converts tensor to scalar | For logging metrics |
.detach() | Removes tensor from graph | When you need a tensor but not gradients |
device=x.device | Creates tensors on same device | For masks, buffers, custom tensors |
| Gradient Accumulation | Simulates large batches | When you have limited VRAM |
| Mixed Precision (AMP) | Uses FP16 for memory savings | When you need 30-50% less memory (GPU ≥ 7.0) |
| Gradient Checkpointing | Discards and recomputes activations | When you need 60% less activation memory |
| PyTorch 2.x Memory Tools | Records and visualizes memory | Finding graph leaks and memory hotspots |
| NCCL Environment Vars | Fixes DDP communication issues | For NCCL timeout and network errors |
Once you understand the memory lifecycle and the device rules, PyTorch becomes far less mysterious. These aren’t random failures – they’re signals telling you exactly what’s wrong.